US Personal Income Dec: 0.6% (est 0.1%; prev -1.1%) US Personal Spending Dec: -0.2% (est -0.4%; prev -0.4%)
US Personal Income Dec: 0.6% (est 0.1%; prev -1.1%)
US Personal Spending Dec: -0.2% (est -0.4%; prev -0.4%)
Nice gain from personal income above estimates and first in 3 months as gov't benefits ticked back up for the first time in several months. Real spending (inflation adjusted) was down for the 2nd month in a row at -0.2% as PCE was up 1.3%, a 3-month high. Ex-food and energy PCE was up 1.5% which ties a post-recovery high I believe. Savings rate ticked up to 13.7% October income was revised down one tenth, November two tenths and November spending was revised down three tenths to -0.7%.
The report does a good job breaking down personal income. Basically everything improved but sole proprietor income (down for 2nd month in a row -4.5%) with employee comp up 0.5% and transfer payments up 2.3%.
The increase in personal income in December primarily reflected increases in government social
benefits, compensation, and personal dividend income that were partly offset by a decrease in
proprietors’ income (table 3).
• Within government social benefits, unemployment insurance increased reflecting an increase in
pandemic unemployment compensation, the supplemental weekly payments to unemployment
beneficiaries re-introduced through the CRRSA Act. There was also an increase in “other” social
benefits, reflecting an increase in payments from the Provider Relief Fund to nonprofit
institutions.
• Within compensation, the main contributor was an increase in wages and salaries in service producing industries based on data from the Bureau of Labor Statistics Current Employment
Statistics.
• The increase in personal dividend income reflected data from company financial reports.
• Within proprietors’ income, both farm and nonfarm decreased based on declines in Paycheck
Protection Program loans to businesses. Farm proprietors’ income was also impacted by a
decrease in payments under the Coronavirus Food Assistance Program.
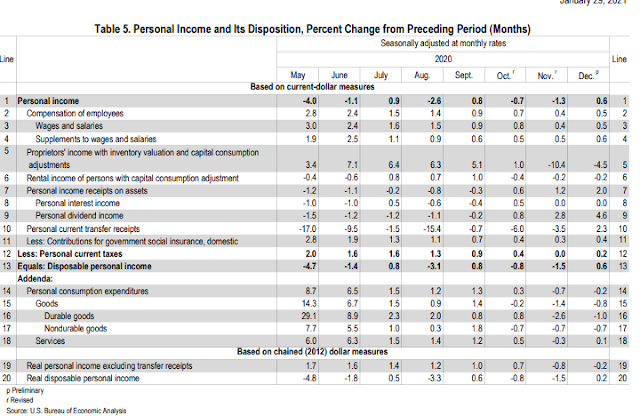
On spending, goods were down -0.8% with durables down -1% and non-durables -0.7%. Services were up 0.1%.
The $79.8 billion decrease in real PCE in December reflected a decrease of $71.9 billion in spending for goods and a $17.6 billion decrease in spending for services (table 7). Within goods, durable goods (led by recreational goods and vehicles) and nondurable goods (led by food and beverages) both contributed to the decrease and were partly offset by an increase in spending for motor vehicles and parts (led by new light trucks). Within services, the largest contributors were decreases in spending for food services and accommodations (led by food services) and spending for health care (led by hospitals). These were partly offset by an increase in spending for household utilities (led by electricity).


Comments
Post a Comment