Posts

Showing posts from February, 2021

Daily Summary – February 26, 2021 - Into March we go...

Image
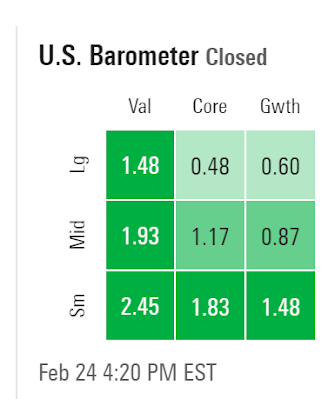
       Daily Summary – February 26, 2021 In last night's wrap up I said we're in pretty poor technical shape, particularly outside the SPX, but we generally have seen a good bounce following days like this. If we don't get one (or if we get a weak one) it will be instructive. I'll reserve judgment on what happens going forward until I see how markets follow up on today's action. Well, for a bounce-back day that was pretty lame. I mean you're at least supposed to finish up. That was too much for the SPX though which finished down around a half percent.  RUT was basically flat while NDX and Naz both did manage to finish with gains in the six tenths area. But the only style boxes that were green were the growth ones and large value got sold. More on that later. For the week all four closed solidly red and despite the gain the week was enough to push NDX and Naz into the red for the month (Naz by only a few points). This is the second straight red month for the NDX

Personal Income up 10% (above exp's), spending 2.4%, savings rate now 20.5%... more here...

Image
  US Personal Income Jan: 10.0% (est 9.5%; prev 0.6%) US Personal Spending Jan: 2.4% (est 2.5%; prevR -0.4%; prev -0.2%) US Real Personal Spending Jan: 2.0% (est 2.2%; prevR -0.8%; prev -0.6%) With the new fiscal stimulus in January, huge gain in personal income driven by gov't transfers, but compensation was also up for the 7th straight month increasing by 0.7%. Proprietor's income did fall by half a percent.  Real spending also up (after two months of contraction) but as it was not up nearly as much, savings rate shot up to over 20% (!).  Consumers are back to having a lot of dry powder.  Ex-food and energy PCE was up 0.3% m/nm (same as Dec.)   November income and spending were both revised up one tenth.  Table at the end. On personal spending, the report does a good job of breaking that down but in general goods were up 5.8% with durables up 8.4% and non-durables 4.3%. Services more muted at 0.7%: The $340.9 billion increase in current dollar PCE in January reflected an incr

Daily Summary – February 25, 2021

Image
      Daily Summary – February 25, 2021 In last night's wrap up I noted bounce backs after high volume flushes sometimes marked a bottom but sometimes didn't.  In that regard I noted some reasons to expect more future gains (liquidity, coming stimulus, vaccines) but also some reasons for caution -  "On the side of caution is resistance just overhead for Naz and NDX, some still unresolved technical issues, those yields creeping up that seem to have unnerved some, and what I'd imagine is a monthly rebalancing of some sort needing to be done for those funds that rebalance monthly."  Don't know how much the first and last contributed, but probably some, but it was the middle one, yields, that according to most accounts of today was the catalyst for our second big down day in the last three days (so, no, that wasn't a bottom). SPX, RUT, NDX, and Naz were sent to lowest closes since beginning of the month and put several of them in dicey technical conditions. As

US Kansas City Fed Mfg Activity Feb: 24 (est 15; prev 17)

Image
US Kansas City Fed Mfg Activity Feb: 24 (est 15; prev 17) Strong regional reports continue with KC Fed mfg rising to 24 vs. 15 est. & 17 in prior month (barely below recent peak in May 2018 and now up y/y for first time since a year ago). Production, employment, and average employee workweek all up as was six-mth outlook to the highest since summer 2018. Also rising though were prices with raw materials prices second highest increase in survey history. “Regional factories reported higher activity in February,” said Wilkerson. “Most businesses reported more production and shipments, despite some difficulties due to the extreme weather events recently. However, rising materials prices and shipping delays have negatively affected 85% of firms.”  Manufacturing activity growth was driven by durable goods plants, specifically by primary and fabricated metals, machinery, and transportation equipment. Month-over month indexes for production and employment increased at a faster pace in F

US Pending Home Sales (M/M) Jan: -2.8% (est 0.0% prev R 0.5%)

Image
US Pending Home Sales (M/M) Jan: -2.8% (est 0.0% prev R 0.5%) Pending Home NSA Sales (Y/Y) Jan: 8.2% (prev R 23.1%) Pending home sales dip down a bit but remain at very high levels.  A sale is listed as pending when the contract has been signed but the transaction has not closed, though the sale usually is finalized within one or two months of signing.  Here is some redacted commentary from the report. Pending home sales took a step backward in January as inventory constraints continue to hold back prospective buyers, according to the National Association of Realtors.  The South was the lone region with a modest gain from the month prior, however, all four areas saw contract transactions increase from a year-over-year standpoint [NKS - ranging from +8.6% in the MW to +17.1% in the S].  Year-over-year, contract signings rose 13.0%.   "Pending home sales fell in January because there are simply not enough homes to match the demand on the market," said Lawrence Yun, NAR's ch

US Durable Goods Orders Jan P: 3.4% (est 1.1%; prevR 1.2%; prev 0.5%)

Image
   US Durable Goods Orders Jan P: 3.4% (est 1.1%; prevR 1.2%; prev 0.5%) US Durables Ex Transportation Jan P: 1.4% (est 0.7%; prevR 1.7%; prev 1.1%) US Cap Goods Orders Nondef Ex-Air Jan P: 0.5% (est 0.8%; prevR 1.5%; prev 0.7%) US Cap Goods Ship Non-Def Ex-Air Jan P: 2.1% (est 0.6%; prevR 1.0%; prev 0.7%) Another big beat from durable goods for January (and Feb was revised up) with ninth consec month of gains pushing this index (as well as the cap goods orders) well above pre-pandemic levels. Durable Goods Headline increase driven by transportation, up eight of the last nine months, up 7.8 percent to $85.1 billion (I've been saying just wait until Boeing gets going - new orders for aircraft and parts were up 389%(!) non-defense and 63.5% defense).  Even without transp solid gain of 1.4% and 2.3% excl defense. Manf was up 4.8%, metals +3.2%, electrical equipment and appliances +4.2%.  Largest decrease was communications equip down almost 10%. Computers  and Machinery were around fl

Initial Jobless Claims(SA) for week ending Feb. 20: -111K to 730K vs. 815K consensus, 841K prior (revised from 861K).

Image
     Initial Jobless Claims (SA) for week ending Feb. 20: -111K to  730K  vs. 815K consensus, 841K prior (revised from 861K). Initial PUI claims - 61k to 452k . Four-week moving average for week ending Feb. 20 was 808K , down 20.5K from the previous week's average of 828K. The advance number of actual initial claims under state programs, unadjusted, totaled 710.3K , an decrease of 131.7K (or 15.6%) from the previous week. Continuing jobless claims (delayed one week) of 4.419M is down from 4.520M and higher than 4.467M consensus. The total number of continued weeks claimed for benefits in all programs for the week ending January 30 was  19M , an increase of -+701K from the previous week almost all coming from Pandemic claims recipients with UI claims falling around -137K between regular and extended benefits. I will continue to report jobless claims although it appears from both anecdotes and reporting anomalies (Ohio had a massive increase in pandemic claims last week) that there

EIA - Summary of Weekly Petroleum Data for the week ending February 19, 2021

Image
  EIA - Summary of Weekly Petroleum Data for the week ending February 19, 2021  US DoE Crude Oil Inventories (W/W) 19-Feb: 1285k (est -5190K; prev -7257K) - Distillate: -4969k (est -3746K; prev -3422K) - Cushing: 2807k (prev -3028K) - Gasoline: 12k (est -3062K; prev 672K) - Refinery Utilization: -14.50% (prev 0.1%) Ok, a lot here. Big picture there was a lot of puts and takes with the weather issues in TX but because of all the refinery closures outside of gasoline we saw big inventory drawdowns totalling 13.8mb across all petroleum products. This basically now eliminates the products surplus from the pandemic. Crude - As with API saw a build instead of a large draw as predicted. The main issue is that refinery runs were down 2.59mbd w/w due to the weather and power issues in TX while production was only down 1.1mbd. Imports were also down due to port closures, pipeline issues, etc. (down by 1.3mbd), but so were exports (by 1.55mbd) for the same reasons, so small build there also.

Daily Summary – February 24, 2021

Image
       Daily Summary – February 24, 2021 In y'day's conclusion I mentioned y'day had sort of a washout feel and thought we'd likely see a bounce in the SPX and RUT, which we definitely got (RUT was green from the get go), but I wasn't sure about the Naz and NDX given the muted buying volume and technical conditions.  But just like y'day (well, actually 20 minutes later today but again right around the time Powell started talking (although we also had a very good new home sales report at that time)) stocks bottomed, and by the end of the day all of the above finished firmly in the green led by RUT up over 2%. SPX was up over 1% and Naz and NDX up just under 1%. The widely watched DJIA also pushed to an ATH today. It was the value stocks which led again, though, and, again, the small value in particular. This recent outperformance has pushed the value/growth ratio to a new 8-mos high and the small value to large growth (IWN/QQQ) to a new recovery high (see charts)

January New Home Sales: +4.3% M/M to 923K vs. 855K expected and 855K prior (revised from 842K).

Image
  January New Home Sales :  +4.3%  M/M to 923K vs. 855K expected and 855K prior (revised from 842K). New Home Sales (M/M) Jan: 4.3% (est 1.6%; prev 1.6%); 19.3% Y/Y Big beat from Jan new home sales and three prior months all revised up. New home sales now up over 19% y/y. Data is below but biggest increase in MW (+12.6%) followed by W (6.8%) then S (3%). NE saw pullback of 13.9%. Y/Y S up huge 40%, MW 10% but W down 6% and NE almost 9%. Months supply ticked down further to 4.0 and average selling price also ticked up to $409K from $395K. But median price actually fell for the first time in several months to $346K from $353K.  

Int'l - 2/24/21

Image
 Int'l Update - Date mostly from Briefing.com with some adds. Indices as of 8 am. Never thought about the fact that Japanese government is sitting on big gains in its ETF purchases. Asia Equity indices in the Asia-Pacific region ended the midweek session on a lower note outside of India which finished up strongly. Japan's Nikkei: -1.6% Hong Kong's Hang Seng: -3.0% China's Shanghai Composite: -2.0% India's Sensex: +2.1% South Korea's Kospi: -2.5% Australia's ASX All Ordinaries: -0.9%. In economic data:  - Japan's January BoJ Core CPI -0.3% yr/yr (last -0.3%) - South Korea's March Manufacturing BSI Index 83 (last 84) - Australia's Q4 Construction Work Done -0.9% qtr/qtr (expected 1.0%; last -2.6%). Q4 Wage Price Index 0.6% qtr/qtr (expected 0.3%; last 0.1%); 1.4% yr/yr (expected 1.1%; last 1.4%) - Hong Kong's Q3 GDP 0.2% qtr/qtr, as expected (last 2.8%); -3.0% yr/yr, as expected (last -3.5%) In news: Japan's Finance Minister Aso said that a

US MBA Mortgage Applications Feb 19: -11.4% (prev -5.1%)

Image
  MBA Mortgage Applications  US MBA Mortgage Applications Feb 19: -11.4% (prev -5.1%) Composite Index:  -11.4% .  Purchase Index:  -12% . Non-SA up 7% y/y. Refinance Index: - 11 % .  Non-SA up 50% y/y. 30-year mortgage rate increased to 3.08% vs. 2.96%. Combination of higher rates, increasingly scarce inventory, and bad weather saw mortgage apps cont to decline this week, with first big fall in purchase apps in a while, now up only 7% y/y (was more like 17% last week). Given the weather issues, going not going to read too much into this, but I wouldn't be surprised to see mortgage apps level off with rates likely having bottomed and inventory issues.  From the report: “Mortgage rates have increased in six of the last eight weeks, with the benchmark 30-year fixed rate last week climbing above 3 percent to its highest level since September 2020. As a result of these higher rates, overall refinance activity fell 11 percent to its lowest level since December 2020, but remained 50 perce

Daily Summary – February 23, 2021

Image
      Daily Summary – February 23, 2021 I had a couple of thoughts book ending y'day: .... while the indices made an attempt at a rally in the afternoon, that faded in the last hour, and all four indices finished basically at the lows of the day. Not a great setup for tomorrow.... [W]hether it's because of rising rates, rotation action, or whatever, there's been a clear break away from growth towards value last few days, including even the "loved" companies like TSLA which was down over 8% today. As I mentioned above, this sort of action has normally corrected itself quickly in the past. Whether it does this time remains to be seen.  Well, let's just say the jury is still out. But as of the close things look a little more stable then they did around 9.50 this morning when after a weak overnight session that saw stocks opening solidly in the red and a first 20 minutes of trading that saw the SPX lose 50 points in straight down manner, the indices bounced like b

US Conf. Board Consumer Confidence Feb: 91.3 (est 90.0; prev r 88.9)

Image
  US Conf. Board Consumer Confidence Feb: 91.3 (est 90.0; prev r 88.9) - Present Situation Feb: 92.0 (prev r 85.5) - Expectations Feb: 90.8 (prev r 91.2) Consumer confidence ticked up a bit this month due to increase in present situation but expectations fell a touch and we remain far from pre-pandemic levels.  Cutoff date was Feb 11.  h/t to Schwab for the charts. CB does a good job of breaking it down: “After three months of consecutive declines in the Present Situation Index, consumers’ assessment of current conditions improved in February,” said Lynn Franco, Senior Director of Economic Indicators at The Conference Board. “This course reversal suggests economic growth has not slowed further. While the Expectations Index fell marginally in February, consumers remain cautiously optimistic, on the whole, about the outlook for the coming months. Notably, vacation intentions—particularly, plans to travel outside the U.S. and via air—saw an uptick this month, and are poised to improve fur

Philadelphia Fed Non-Manufacturing Firm-Level Business Activity Index Feb: 7.5 (prev -14.3)

Image
   Philadelphia Fed Non-Manufacturing Firm-Level Business Activity Index Feb: 7.5 (prev -14.3) Philadelphia Fed Non-Manufacturing Firm-Level Business Activity Index Feb: 7.5 (prev -14.3) Philadelphia Fed Non-Manufacturing Regional Business Activity Index Feb: 3.9 (prev -17.5) Philadelphia Fed Non-Manufacturing New Orders Index Feb: 4.0 (prev 0.2) Philadelphia Fed Non-Manufacturing Full-Time Employment Index Feb: 2.8  (prev 3.1) Philadelphia Fed Wage And Benefit Cost Index Feb: 21.7 (prev 16.4) Survey responses were collected from February 8 to February 18 . Philly Fed services current activity rebounds from Jan's negative reading back into positive territory with increases in general activity, new orders, and sales/revenues edging all of those into modestly positive territory (details below). Full-time employment came in a touch lighter (but still positive) but wages increased above 20. Prices also remained at very high levels with prices paid up over 30 and prices received (which