Weekend Thoughts - 04/18/21 - A collection of items that didn't make it into other notes this week. Sort of a random mish-mash, but think there's some interesting stuff here.
A collection of items that didn't make it into other notes this week. Sort of a random mish-mash, but think there's some interesting stuff here.
Brian Gilmartin provides his normal excellent breakdown of S&P 500 earnings trends. Unlike what we'd seen normally prior to the pandemic, future quarters continue to move up as we start to make our way through the season. Earnings not keeping up with price though pushing the earnings yield down a bit.

Those earnings coming through are important if we're going to get that P/E compression.

And Helene Meisler retweeted this interesting seasonal pattern of Russell 2000 (small caps) to 1000 (larger caps) that we've generally followed this year. This would seem to call for a return to prominence of RUT over SPX for the next couple of months before another even bigger shift the other way in July - Aug.

Interesting thought experiment from M*. 9% is well within the realm of possibility (even if it's a bit misleading as I'm sure the life expectancy of Senators far exceeds that of the general population). But I think a bigger point is that when things are as priced for perfection as they are now, it doesn't take much to knock stocks down a notch or two.

In her weekly ChartFest Helene Meisler notes the improving Summation Index (what the average stock is doing), which has moved up and cleared the last high which is good.

But Naz new lows are creeping up despite the record highs.

And insider selling literally almost off the charts. Seems like there has to be something odd here (data error, some huge event that is being imputed to this, etc.)? Also, I'd note that insider buying is much more predictive (of bottoms) than insider selling is (of tops).

Haven't updated on equal weighted versus market cap in a while but WSJ noted it, and it continues to demonstrate that the average stock continues to participate at least as much as the biggest. That's a very healthy sign.

On housing, exacerbating home price unaffordability is the incessant demand for second homes or investment properties. As a proportion of total apps is highest since the housing boom. Will be interesting to see if the 7% Fannie and Freddie limits on these will have any impact (they are rolling that out now). As they're at 14% now from this chart, I'd have to imagine this will have some impact which would be good for first time buyers.

Consumer debt continues to look very manageable. In that regard mortgage debt is only slightly above 2007 levels while incomes are well above.

And if there's a problem getting a new loan, it's not that the banks don't have the capacity.

While Treasury Dept asks how debt markets would react to a debt limit being imposed by Congress. Umm, how about badly?

And looks like people might be starting to spend some of that "cash on the sidelines" according to last week's fund flows.
- In the latest U.S. weekly fund flow insight report by Refinitiv Lipper ending April 14th, 2021, data points to the fact that investors were net redeemers of fund assets for the first week out of the past ten.
- Market participants withdrew -$14B out of the marketplace, which is significant in nature as investors have been net purchasers of fund assets week after week since mid-February. Fund assets include both conventional funds and exchange traded funds.
- Breaking it down, money market funds saw all of the negative outflows at -$27.8B, taxable bond funds +$9.1B, tax-exempt bonds +$2.3B, and equity funds +$760M.
- Exchange traded equity funds recorded their tenth straight positive week of net inflows, pulling in +$3.2B for the week. Furthermore, the information technology sector witnessed +$1.1B in inflows while banking/financial exchange traded funds saw -$209M in outflows.
- The three equity-based ETFs that saw the largest inflows on the week were iShares Core MSCI EAFE (BATS:IEFA) +$826M, SPDR S&P 500 ETF (NYSEARCA:SPY) +$555M, and Ark Innovation (NYSEARCA:ARKK) +$412M. In reverse, the top three equity ETFs to see the most significant redemptions were iShares Russell 2000 ETF (NYSEARCA:IWM) -$961M, Invesco QQQ Trust 1 (NASDAQ:QQQ) -$807M, and ProShares Ultra Pro QQQ (NASDAQ:TQQQ) -$563M.
- Examining fixed income-based ETFs and investors can see the space attracted $3.2B in net inflows. Corporate-investment grade ETFs pulled in +3.2B and corporate-high yield ETFs -$761M. Taking a step back and looking at investment grade versus high yield from a year-to-date standpoint and market participants can see they have recorded an estimated net flows of +$24.4B and -$1.3B, respectively.
- The top three fixed-income ETFs that saw the highest inflows were iShares iBoxx Investment Grade Corporates (NYSEARCA:LQD) +$942M, iShares Core U.S. Aggregate Bond (NYSEARCA:AGG) +$585M, and Schwab U.S. TIPS ETF (NYSEARCA:SCHP) +$359M. On the flip side, the top three weekly net outflows went to SPDR Bloomberg Barclays High Yield Bond (NYSEARCA:JNK) -$717M, iShares 20+ Treasury Bond ETF (NASDAQ:TLT) -$303M, and iShares iBoxx High Yield Corporates (NYSEARCA:HYG) -$217M.
- From a sector standpoint, the information technology space witnessed +$1.1B in inflows.
And a nice article from Lisa A about why inflation might actually be transient as the Fed thinks.

"Once the boom of revenge shopping and postponed vacations is over, it’s likely there will still be plenty of cash sloshing around checking accounts or put toward buying stocks and bonds. Wealthier people’s closets are full and their garages are packed. Lower-income households are still facing issues of job insecurity and sluggish wage gains, and it’s unclear if they’ll take on more debt without a much more robust labor market.
This gives credence to the market pricing of inflation, which shows an acceleration in near-term price increases and then a longer-term slowdown as the economy settles down into its more familiar, humdrum rhythm. Helicopter money succeeded in plugging a gap in lost business from the pandemic, but it’s harder to see how it alone could lead to a sustained period of surging prices and an extraordinarily hot economy."
While I guess cryptos had a bit of a price issue last night.

And a new headwind for auto production.

With Chinese car sales down 7% from 2019 levels.

And Cuba without a Castro?

But I can't have a weekend piece without a note on the energy markets (remains by far my largest overweight) right?
Oil rigs continue to slowly follow the frack spread up.

While net length appears to have stalled out well below prior peaks.

Although traders appear to be getting back into WTI (which we knew was probably the case with the support to prices this week).

As drivers in the US return to the roads (does this mean we have traffic jams again?)

Leading to more Russian fuel oil imports.

While we also see a pickup in Chinese and Japanese demand.

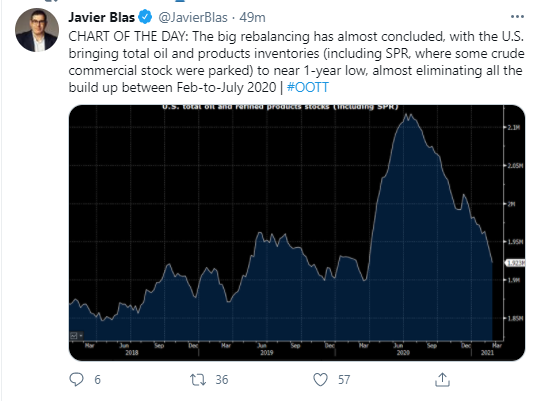
Continuing to push down stockpiles.


And JCPOA talks continue with Iran feeling enough progress has been made to start working on a text.

Although clear divisions exist internally in Iran.

Meanwhile, I guess it's not a surprise that Indian Covid cases are spiking.

And Ontario a bit of a mess.

While Covid cases in Japan put pressure on the Olympics
"Daily cases in Osaka reached a record 1,208 on Thursday, driven by a virulent British strain of the virus. New infections rose to 729 in Tokyo, the most since early February when most of the nation was under a state of emergency.Almost two-thirds of Japanese said the Olympics should be canceled or postponed, a Jiji news poll showed on Friday."
But at least the US vaccinations continue to progress at a great pace.

To see more content, including summaries of some of today's economic reports and my morning and nightly updates go to https://sethiassociates.blogspot.com


Excellent commentary and loads of information
ReplyDelete. Thanks