Daily Summary – September 30, 2021 - Must Be September
Please excuse typos. As a side note, after talking with some followers, I'm going to try to make this a little more digestible for those who are not as familiar with the markets, lingo, etc. Feel free to leave your thoughts in the comments section, they are appreciated. Also, don't discuss crypto much as I'm still not that familiar with it.
Also starting a small glossary to help.
SPX = S&P 500
Naz = Nasdaq Composite
NDX = Nasdaq 100 (100 largest stocks in the Naz)
RUT = Russell 2000 (smaller stocks)
DMA = Daily Moving Average (the moving average over the given time period (20, 50, 100, 200 days normally)).
MACD = Moving Average Convergence Divergence (basically a trend indicator)
RSI = Relative Strength Index (basically what it sounds like)
__________________________________________________________________
If you missed the opener, a lot of stuff in there so might want to skim it.
Major US equity indices closed out another red September with a solidly red day with the SPX closing below its 100-DMA for the first time since last October, and giving the index its worst month since March 2020 ending down 4.8% for the month and its weakest quarter since 1Q2015. It was the first down month for the SPX since January. So for the second September in a row, seasonality won the day. The good news is October is normally better (just gotta' get through the volatility).
Continued uncertainty of the debt ceiling combined with margin uncertainty following weak guidance from Bed Bath & Beyond (following on guidance cuts from Sherwin Williams, Micron, and others) to overpower any good of a deal on funding the government (which was only for two months anyway). Most anything having to do with the consumer got hammered today (retail, homebuilders, consumer staples, etc.).
Selling accelerated into the close with a large "market on close" number (needed to be sold to settle up). Not sure if that was due to rebalancing activity, etc. At the end, the SPX ended down -1.2% on the day, RUT -0.94%, NDX -0.43% and the Naz -0.44%. The Naz ended the month down -5.3% while the RUT was down -5.5%
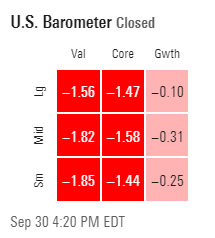
Style box all red again today but in contrast with yesterday it was growth that outperformed perhaps helped by yields falling.
Major Market Technicals
As noted above the SPX closed below the 100-DMA for the first time since October 2020 but was able to stay just above the low from last Monday. That gives it a shot to bounce from here. Daily technicals remain bearish though.
NDX and Naz are both at the lowest levels since the summer with the Naz falling just below its 100-DMA while the NDX is just above. Both are very oversold. RUT fell back under its 200-DMA but remains well above lows from last Monday.
And since it's month end a quick check of the monthly charts shows them all in positive technical configurations but also showing topping behavior, with MACD's flattening out and crossovers or close to it of RSI's from above to below the 70 level. Here's the SPX but they all look similar.
SPX Sector Flag
Ugly SPX sector flag today with every sector down at least -0.3% and ten down at least -0.7%, and eight at least -1.24%. Big growth sectors marginally outperformed but just a lot of red. Two sectors (RE and staples) had no green stocks.
SPX Sector Technicals Rankings
These are NOT necessarily in the order that I like them for investment but how their underlying technical fundamentals stack up. I do often buy calls though when I upgrade. Going to keep playing with the groupings so bear with me. Started to bold changes.
Today further undid any progress we had been seeing earlier in the week. Several sectors are getting oversold though.
- Sectors with good/ok technicals not stretched/overbought, above most resistance.
XLE - Energy - MACD go long, RSI positive, over all MA's.
XLF - Financials - MACD go long, RSI neutral, below multiple MA's.
- Sectors with mediocre to poor technicals but above all/most resistance.
- Sectors that look to have bottomed with positive technicals but below significant resistance.
None.
- Sectors regrouping (negative technicals, short-term downtrend, long-term still positive/uptrend).
XLY - Discretionary - MACD sell longs, RSI neutral, below multiple MAs. Downgraded today but hoping it can bounce back quickly.
XLI - Industrials - MACD go short, RSI neutral, below multiple MA's.
XLB - Materials - MACD go short, RSI negative, below multiple MA's.
XLK - Tech - MACD go short, RSI neutral, under multiple MA's.
XLP - Staples - MACD go short, RSI neutral oversold, under multiple MA's.
XLC - Communications - MACD go short, RSI positive divergence, under multiple MA's.
XLV - Health care - MACD go short, RSI positive divergence and oversold, under multiple MA's.
XLU - Utes - MACD go short, RSI oversold, under multiple MA's.
XLRE - Real Estate - MACD go short, RSI oversold, below multiple MA's.
- Sectors in poor shape (and in intermediate or long term downtrends (so expect further weakness for a while)).
None.
Quick check of the monthly charts look shows similar looks to that discussed above for the indices (topping action) with the exception of energy which still looks solid. No MACD crossovers yet though.
Key Subsectors - SOX (semis), IYT (transp), XBI/IBB (bios), XHB (homebuilders), XRT (retail)
bios were able to stay just in green territory but the rest were red. Retail got the worst of it down almost -5%, homebuilders down over -3%. Transp down -1.65%. Semi's were just mildly red.
On the monthly charts a broken record here (topping action see description of SPX above).
Breadth
Volume outperformed on the Naz but the rest was pedestrian. On NYSE volume was 30% positive and issues 35%. Naz was 63% positive volume, issues 45%. So that Naz volume was very good the rest pretty average.
Commodities/Currencies/Bonds
Bonds - Unlike yesterday longer yields stayed down falling across the curve from the 2-year duration and higher by one to three basis points. 2-year yields finished down two basis points at 0.28%, five years were down three basis points to 0.98%, 10-years by three basis points to 1.52% and 30 years by one basis point to 2.08%.
Dollar (DXY) - After moving to new 52-week highs (see last night's summary) held around those levels at $94.25. Daily technicals remain positive but overbought. Monthly we got a MACD cover shorts signal and the RSI is breaking out. So monthly technicals are positive.
VIX - Did rise but less than one point to 23.14.
Crude (/CL) - Some crosscurrents had oil bouncing around today. It was up in the morning on news that China was starting to rebuild its reserves but then fell in the afternoon on a report out of Reuters that at least four sources said OPEC+ was weighing releasing more oil than the scheduled 400kbd increase in November. Ended up the day around unchanged levels at $74.98. Did bounce off that uptrend line today. Technicals remain firmly positive on monthly chart as well as the daily chart.
As at least one trader is uber-uber bullish crude with 1300 calls trading on Dec 2022 $200 Brent. BBG.
Nat Gas (/NG) - Remains incredibly volatile with an outside day (today's range totally covers yesterday's) which is saying a lot considering yesterday was down -5%. Today reversed from losses to end up 9%(!). Crazy. New 7-year closing high. Daily and weekly technicals are positive with weekly RSI very overbought. Monthly technicals also positive but RSI is the most overbought it's been in 20 years.
As storage report comes in around expectations.
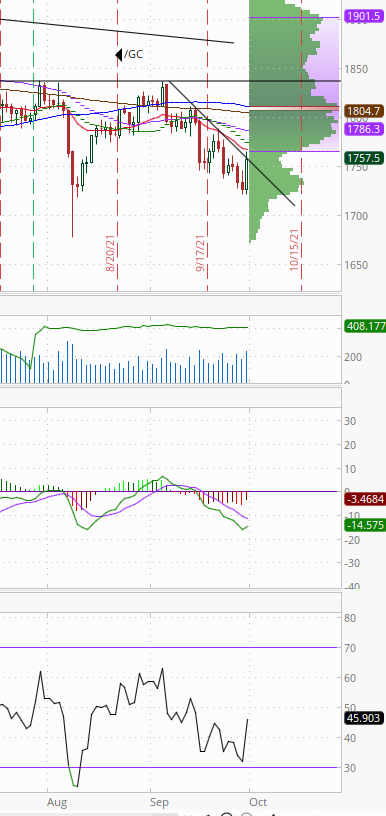
Gold (/GC) - Was able to get a bounce closing just under that downtrend line up 2% to $1757. Daily technicals remain negative but trying to turn.
Copper (/HG) - Continues to selloff although bounced off uptrend line. Now below the 200-DMA. Technicals remain negative daily chart.
Did report on jobless claims today.
Initial Jobless Claims week ending Sep 25th seasonally adjusted: +11K to 362K vs. 335K consensus, 351K prior. Non-SA -8K to 298K. - seasonally adjusted claims tick up but non-SA fall as do continuing and huge drop in total rec'ing benefits - details
https://seekingalpha.com/instablog/15085872-cbus-neil/5645277-initial-jobless-claims-week-ending-sep-25th-seasonally-adjusted-plus-11k-to-362k-vs-335k
Next 24
Big data day in the US tomorrow. We get the ISM Manufacturing Index for September, Personal Income and Spending for August, PCE Prices for August, the final Univ. of Michigan Index of Consumer Sentiment for September, Construction Spending for August, and the final Markit Manufacturing PMI for September. It will be busy.
Internationally, we'll have quite a bit of data as well. Highlights are global PMI's, Japanese August employment and Q3 Tanakan surveys, S Korean Sept trade data, August German retail sales and Sept EU CPI.
Sentiment is most decidedly getting more cautious. A majority of participants in a Citigroup Inc. survey said a 20% pullback in stocks is more likely than a 20% rally. We had NAAIM today which was down to its lowest since the summer.
Put call ratio was back over 1 today. AAII bears over 40% for the first time in a year.
Fear and Greed index down to 25.
Ok, you get the idea. Sentiment is much more cautious which makes a bounce normally more likely. And while September is the only month that is on average negative, October is seasonally much better gaining just under 2% on average over the last 10 years.
And with Congress at least kicking the most pressing can down the road (shutdown) markets might look to other areas for the time being with the "deadline" of October 18th a few weeks away. That doesn't relieve the margin and growth stories but we have a lot of data coming tomorrow. If it's good, I think it could be enough to get buyers to engage. At least until those issues potentially reemerge in tandem in a couple of weeks (earnings season unofficially kicks off October 13th with the big banks).
Misc.
Other random stuff.
Repos now over $1.6T.
And we noted Congress was at least able to agree to fund the government (through Dec 3rd) but all eyes remained squarely on the debt ceiling debate (Democrats say they won't do it through reconciliation which means Republicans will have to at least cooperate which they seem incapable of doing so far) as well as the infrastructure bills. On those, a lot of chatter about a memo (below) from the summer from Senator Joe Manchin which shows his "red lines". There are lots. Perhaps the biggest of which is his top number is $1.5B.
And while on the topic of Joe Manchin, it's starting to become clear that Senator Manchin just doesn't like the progressive infrastructure plan. It's not just about the spending (although as noted above that's important) but also just the plan itself. While I still can't imagine nothing gets done, it appears it's going to take a lot of work to get anything accomplished on infrastructure:
Manchin: "Proposing a historic expansion of social programs while ignoring the fact we are not in a recession and that millions of jobs remain open will only feed a dysfunction that could weaken our economic recovery.” ... Manchin went on to insist that “the amount we spend now must… not [be] designed to reengineer the social and economic fabric of this nation or vengefully tax for the sake of wishful spending.” The whole point of Biden’s social spending plan is to “reengineer the social and economic fabric” of the nation. That’s literally the plan, almost verbatim. Maybe you like Manchin’s position, maybe you don’t, but let’s drop the charade. Manchin opposes the plan itself, not just the spending associated with it. ... Needless to say, Manchin’s statement served to harden the resolve of Progressives. “This is why we’re not voting for the bipartisan bill until we get a reconciliation bill,” Pramila Jayapal told reporters. “After that statement we probably have even more people willing to vote no.”
As Nancy Pelosi nevertheless tries to press ahead with a vote on the bipartisan infrastructure plan. BBG.
And on an entirely different topic, iron-flow batteries while bulky are cheap and the necessary materials are plentiful (iron and salt water). BBG.
To see more content, including summaries of most major U.S. economic reports and my morning and nightly updates go to https://seekingalpha.com/user/15085872/instablogs for more recent or https://sethiassociates.blogspot.com for the full history.


Comments
Post a Comment