US Personal Income Sep (M/M): -1.0% (est -0.3%; prev 0.2%); Personal Spending Sep: 0.6% (est 0.6%; prev 0.8%; prevR 1.0%); US PCE Core Deflator Sep: 0.2% (est 0.2%; prev 0.3%) - Income falls on end of pandemic benefits, spending up nevertheless - Neil's Summary
- US Personal Income Sep: -1.0% (est -0.3%; prev 0.2%; prevR 1.0%)
- - Personal Spending Sep: 0.6% (est 0.6%; prev 0.8%)
- - Real Personal Spending Sep: 0.3% (est 0.3%; prev 0.4%)
- US PCE Core Deflator (M/M) Sep: 0.2% (est 0.2%; prev 0.3%)
- - PCE Core Deflator (Y/Y) Sep: 3.6% (est 3.7%; prev 3.6%)
- - PCE Deflator (M/M) Sep: 0.3% (est 0.3%; prev 0.4%)
- - PCE Deflator (Y/Y) Sep: 4.4% (est 4.4%; prev 4.3%)
- US Employment Cost Index Q3: 1.3% (est 0.9%; prev 0.7%)
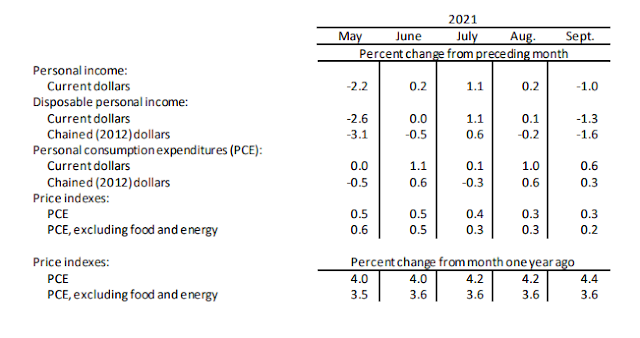

After July's very solid +1.1% m/m and August's +0.2% gain, personal income fell in September as we hit the "cliff" of pandemic benefits expiring, falling -1.0%, more than expectations for a fall of -0.3% (all changes m/m unless noted). Specifically there was a -7% decrease in transfer payments. Continued gains from wages couldn't keep up.
Of course those are nominal numbers, and inflation did continue to take a bite, at +0.3% m/m headline (one tenth lower than August and July) and +0.2% core (also one tenth lower), both as expected. Food and energy were large contributors this month. That reduced "real" (inflation adjusted) income down by that much.
Nominal spending came in at estimates at +0.6% m/m slightly below August's +1.0% gain (revised up from +0.8%) but ahead of July's +0.1% gain (revised up from -0.1%) with "real" spending coming in at +0.3% as estimated. Spending on services outpaced spending on goods at roughly a 2-to-1 rate. The savings rate remained elevated but declined to +7.4% from August's +9.4%.
I'll go through details of each piece independently. Overall, I think it's a good report with private sector continuing to push ahead with wage and income gains and spending remaining solid and well above pre-pandemic levels. Savings rate also remains high. Price pressures continue to show evidence of stabilization outside of food and energy, although non-durables did tick up to what would be a 7.2% annual rate this month. Selected tables at the end.
Personal Income

As noted headline income fell dragged down by the huge fall in government transfer payments as the pandemic unemployment programs rolled off. Also, proprietor's income fell again this month by another -0.7% m/m. Not sure of the reason for that, but it's a big change from what we'd seen earlier this year (table at the end). Otherwise all categories were up led by wages (+0.8%) and rental income (+1.3%). This is the seventh straight month of gains for those components. So the underlying economy continues to perform well, although I'll be watching for more information on the proprietor's income. It should be noted that was also a drag seen on the 3Q GDP report. Real ex-transfer payments income continues to close in on pre-pandemic levels up 0.2% in August.
Along with this report we got the Employer's Cost Index for the third quarter which rose 1.3% q/q and 3.7% y/y. BBG.
Compensation gains were broad-based across sectors, underscoring how a tight labor market has put pressure on many different types of firms to raise wages. Wages and salaries for civilian workers also rose at a record pace, surging 1.5% in the quarter.Unlike the average hourly earnings figures in the monthly jobs report, the ECI isn’t impacted by employment shifts across industries and occupations -- something that’s been particularly severe amid the pandemic.Wages and salaries at companies rose 1.6% in the quarter, also a record. Incentive pay played a key role -- from a year ago, total compensation rose 4.6%. But excluding those perks, it rose 4%.

Consumer Spending

As noted above nominal spending up 0.6% and real spending increased +0.3%. Breaking it down further, spending on goods was up +0.5% after increasing a revised +1.6% in August all due to non-durable goods which increased +0.9% after increasing +2.3% in August. Durable goods spending was down -0.2% after increasing +0.4% in August (revised up from negative) which was the first increase since April. A large part of this is autos. Services up another +0.6% remaining robust (it's been up every month since February.
I think the increase in spending despite the big falloff in pandemic benefits is an unambiguous positive.
From the report:
The $93.4 billion increase in current dollar PCE in September reflected an increase of $63.6 billion in spending for services and a $29.9 billion increase in spending for goods. Within services, the largest contributors to the increase were spending for health care as well as food services and accommodations. Within goods, an increase in spending for nondurable goods was partly offset by a decrease in durable goods. The increase in nondurable goods primarily reflected increases in food and beverages, “other” nondurable goods (led by pharmaceutical products), and gasoline and other energy goods. The decrease in durable goods primarily reflected a decrease in motor vehicles and parts (led by new motor vehicles).
Prices
On prices, as noted headline was up +0.3% m/m and core +0.2%. Goods prices were up 0.5% (down from 0.6% in August) with non-durables leading up 0.6% (was +0.4% in August) and durables up 0.3% (was +0.9%). Services were up three tenths for a second month. Food was up 1.1% (+0.4% in August) and energy was up another +1.3% after increasing 1.9% in August and 1.6% in July.
Looking y/y - "The PCE price index for September increased 4.4 percent from one year ago, reflecting increases in both goods and services (table 11). Energy prices increased 24.9 percent while food prices increased 4.1 percent. Excluding food and energy, the PCE price index for September increased 3.6 percent from one year ago."
Table of m/m income and spending:

Prices

To see more content, including summaries of most major U.S. economic reports and my morning and nightly updates go to https://seekingalpha.com/user/15085872/instablogs for more recent or https://sethiassociates.blogspot.com for the full history.


Comments
Post a Comment